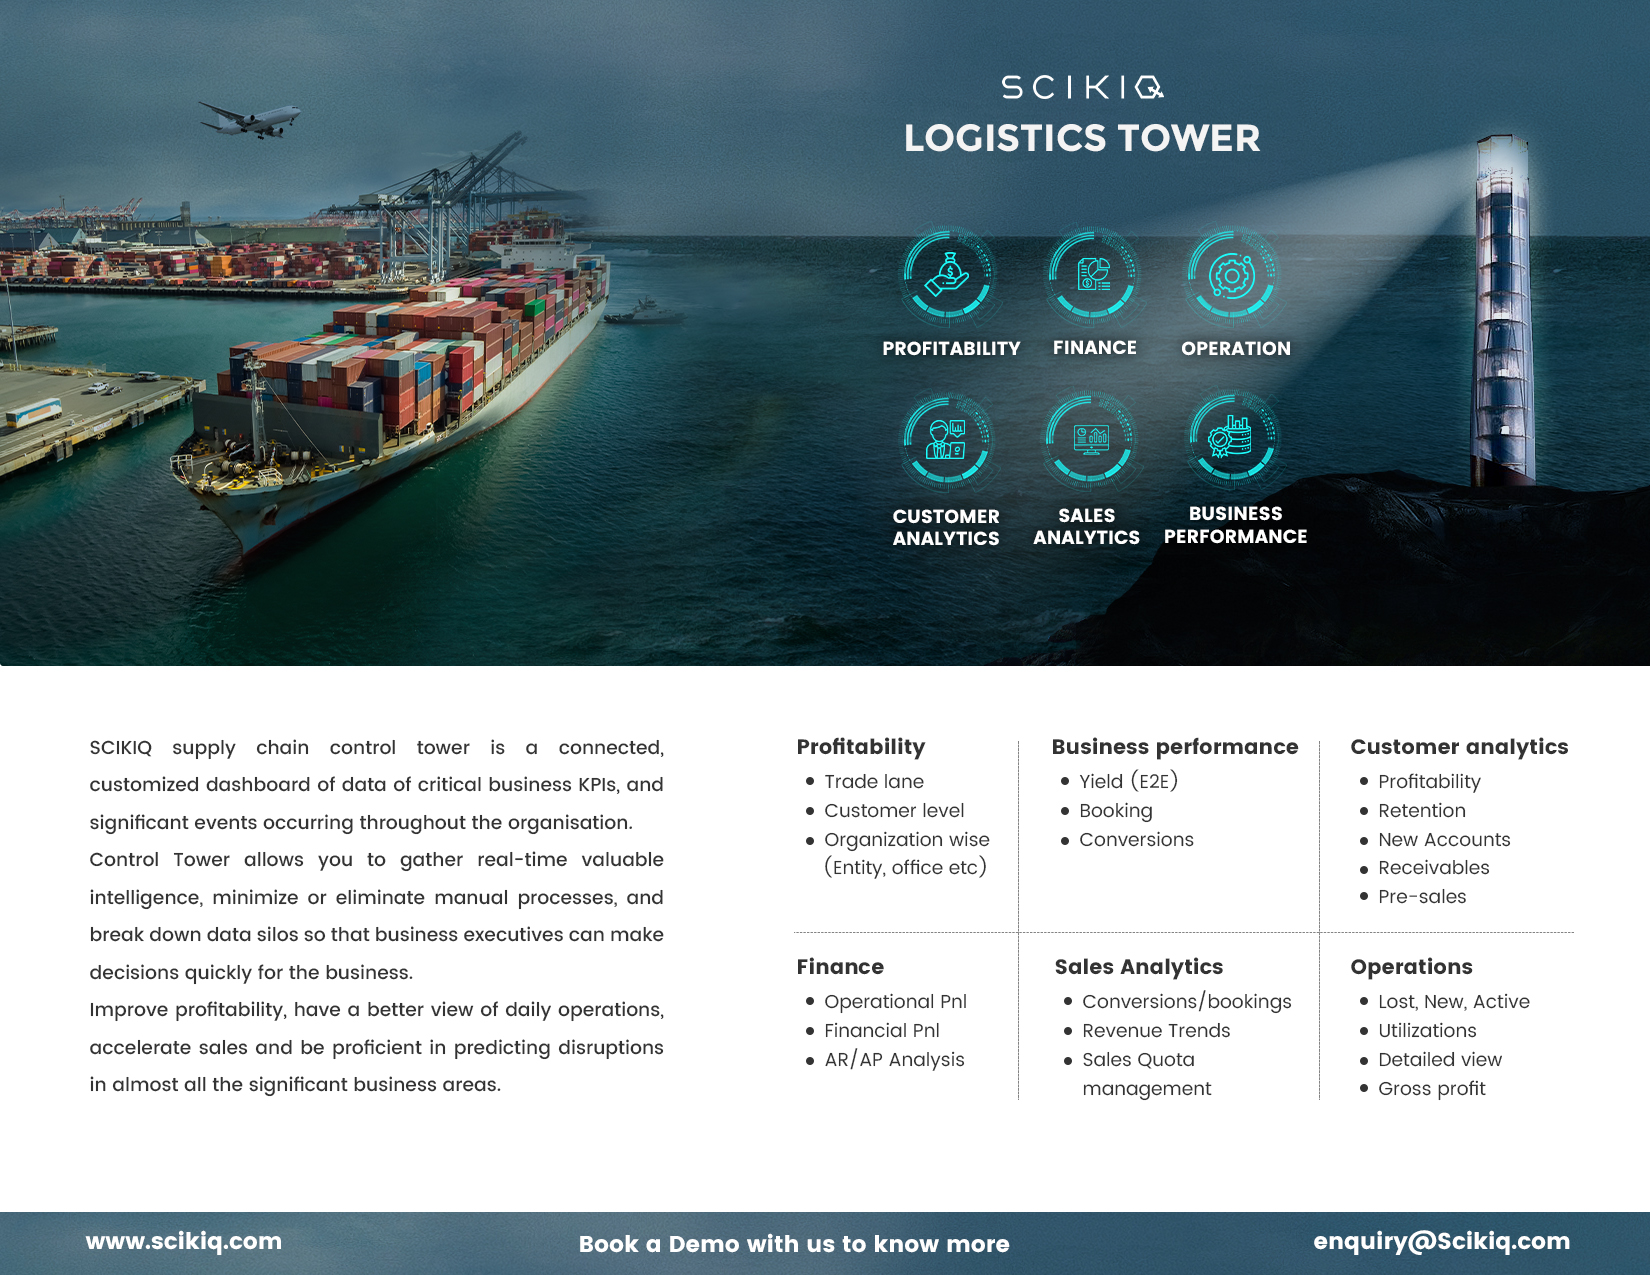
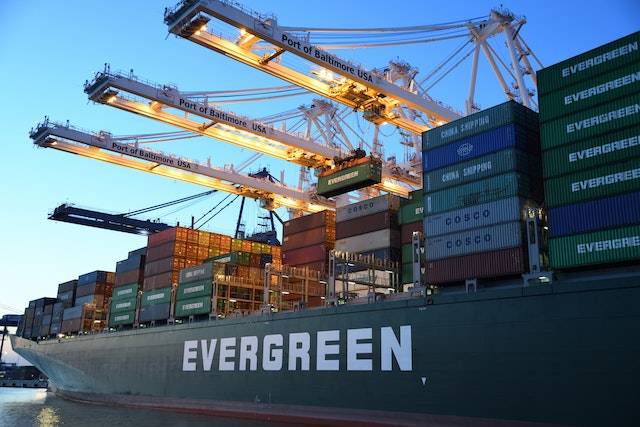
SCIKIQ Supply chain control tower is a connected, customized dashboard of data of critical business KPIs, and significant events occurring throughout the organization. A Supply chain Control Tower allows you to gather real-time valuable intelligence, minimize or eliminate manual processes, and break down data silos so that business executives can make decisions quickly for the business.
Supply chain control Tower have other benefits too like Improve profitability, have a better view of daily operations, accelerate sales and be proficient in predicting disruptions in almost all significant business areas.
Average cost savings: According to a study by Gartner, companies that implement a supply chain control tower can save an average of 5%-10% on their supply chain costs and The average cost of a supply chain disruption is $1 million. A supply chain control tower can help organizations to reduce this cost by helping them to prevent disruptions and by reducing the impact of disruptions when they do occur.
A supply chain control tower enables supply chain organizations to completely understand, prioritize and resolve critical issues in real-time.A Supply chain control Tower enables organizations to monitor and improve key performance metrics and how business is getting impacted on a day-to-day basis. Below are the Most important Metrics one should track.
Profitability: It’s the measure of how much money a business makes after covering all its costs. It includes
- Trade lane: This is a route or path that goods are shipped through from one location to another.
- Customer level: This refers to the individual or specific group of customers that a business focuses on.
- Organization-wise: It’s about how things are divided or categorized within a company, like by department, office, or entity.
Business performance: This is how well a Supply chain Department or company is doing in terms of achieving its goals and objectives. It includes
- Yield (E2E): This is the overall profit made from the start (beginning) to the end (finish) of a process or project.
- Booking: It’s the process of making a reservation or order for a product or service.
- Conversions: These are the number of people who complete a desired action, like buying a product or signing up for a service.
Customer analytics: This is the study of customer behavior and patterns to improve business strategies. It includes
- Retention: It’s the ability of a business to keep its customers over a period of time.
- New Accounts: These are freshly created customer relationships or contracts with a business.
- Receivables: This is money that a company has earned from sales but hasn’t yet received.
- Pre-sales: These are activities done before a customer makes a purchase, like marketing and product demonstrations.
Finance: This is the management of money, including investing, borrowing, saving, forecasting, and budgeting. It includes
- Operational PnL: This is the Profit and Loss statement showing the earnings and expenses from a company’s main business activities or Supply chain Activities
- Financial PnL: This is the Profit and Loss statement reflecting the overall financial performance of a Supply chain including revenue, costs, and expenses.
- AR/AP Analysis: This is the examination of Accounts Receivable (money owed to a company) and Accounts Payable (money a company owes) to assess the financial health of the supply chain and the company.
Sales Analytics: It’s the use of data to understand sales trends and improve sales strategies. It includes
- Conversions/bookings: This is the rate at which potential customers are turned into actual bookings or sales.
- Revenue Trends: These are patterns or changes in the amount of money a company earns over a specific period.
- Sales Quota management: This is the process of setting, tracking, and achieving sales targets.
Supply chain Operations: These are the day-to-day activities that a company carries out to do business. It includes
- Lost, New, Active: These typically refer to the status of customers – ‘Lost’ have stopped doing business with you, ‘New’ are recently acquired, and ‘Active’ are currently engaged with your business.
- Utilizations: This is the degree to which resources (like employees or equipment) are being used effectively.
- Detailed view: This means looking closely at something, with lots of information, to get a deeper understanding.
Improving Supply Chain Profitability & Other KPIs
There is an urgent need for workable solutions given the expanding list of difficulties the logistics sector faces. Fortunately, there are remedies accessible. The majority of current problems can be resolved by digitization and collaborative logistics, which also makes it easier for businesses to plan, manage, and keep an eye on the flow of goods. The business KPI gets better and SCIKIQ can implement a ready logistics control tower for managing these metrics.
Data is critical for the supply chain and logistics industry as they need to track the shipments at all levels. Data is required to optimize inventory, predict accurate estimated times of delivery (ETD), forecast customer preferences, manage demand, and improve speed. In a nutshell, data is all you need at your service at all times without comprehensive use of data, you can’t improve the organization’s KPI or metrics and this is true for a supply chain industry.
How to build a Supply chain control Tower & Dashboard
A supply chain control tower is a centralized platform that provides visibility into the end-to-end supply chain, enabling organizations to monitor and manage their operations in real-time. To build a supply chain control tower, you need to follow a structured approach that involves several key steps.
- Define the scope and objectives: Define the scope of your supply chain control tower, which could include the entire supply chain or a specific part of it, such as transportation, inventory management, or demand planning. Also, define the objectives of your control tower, such as reducing lead times, improving customer service, or increasing supply chain visibility.
- Identify data sources: Identify the data sources that you will use to populate your supply chain control tower. This could include data from ERP systems, transportation management systems, warehouse management systems, and other sources. Ensure that the data is accurate, timely, and relevant to your objectives.
- Choose technology solutions: Choose the technology solutions that will enable you to collect, store, and analyze data. This could include a variety of tools, such as business intelligence software, data visualization tools, and machine learning algorithms. Ensure that the technology you choose is scalable, flexible, and easy to integrate with your existing systems.
- Design dashboards and reports: Design dashboards and reports that provide visibility into your supply chain performance. Dashboards should be customizable, allowing you to monitor key performance indicators (KPIs) and track progress towards your objectives. Reports should be automated and provide insights that enable you to make data-driven decisions.
- Implement processes: Implement processes that enable you to act on the insights provided by your supply chain control tower. For example, you may need to implement processes for inventory management, transportation optimization, or demand planning. Ensure that your processes are aligned with your objectives and that they are communicated clearly to all stakeholders.
- Monitor and optimize: Continuously monitor your supply chain performance and optimize your processes based on the insights provided by your control tower. This will enable you to improve your supply chain performance over time and achieve your objectives.
Overall, building a supply chain control tower requires a combination of technology, processes, and people.
Book a Demo with us to explore how you can improve your supply chain organization with a Supply chain control Tower & right Metrics. Explore the SCIKIQ Supply chain control Tower here. and Book a Demo
Unraveling the Oil Supply Chain: Supply chain Management solutions for energy companies to run the world

6 Comments
Great post! I really appreciate your insights on “Supply chain control Tower Metrics”.I enjoyed reading this post and found it very informative. I love the way you write and the way you explain complex topics so clearly. Your blog is always a pleasure to read. Looking forward to your next post!
Learn more: https://www.tredence.com/solutions/supply-chain-control-tower